Written by Michael Pavarini
Edited by Krista White, GIS Support Specialist
The purpose of this assignment is to understand the procedure of getting data from a GPS unit into ArcMap. Collecting data in the field is a fairly simple process thanks to the advances that are continually being made to GPS devices. Getting the collected data to display in a GIS program takes a few steps. This assignment will demonstrate one method of converting the data taken directly from the GPS device to a workable format in ArcMap10.
Format the GPS Data in Excel
One common way of obtaining data points from a GPS device is to download them from the GPS unit and put them in an Excel spreadsheet. Once in Excel, the data must be reformatted so that it will work in ArcMap.
- Download the sample Excel document "rawGPSdata" from the K drive. Open the file in Excel.
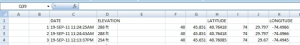
- Examine the columns in the Excel file. Each data point is assigned a unique identifier in the form of a number, the date which it was collected, elevation data, and the coordinates of each point. The coordinates are given in degrees (as an integer) and minutes (a real number). ArcMap handles coordinates best when they are in Decimal Degree format. In Decimal Degress, the entire coordinate string is a single, real number based on the degree. To convert from Degrees and Minutes to Decimal Degrees, follow steps 3-
- Select the entire E column in the "rawGPSdata" file (containing the location)
- Click on the "Data" tab on the top toolbar.
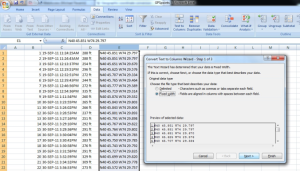
- In the "Data Tools" box, select the "Text to Columns" tool. The Text to Column Wizard will allow you to separate the coordinate information into separate columns.
- Select "Fixed Width" and hit "Next>" (click image to enlarge)
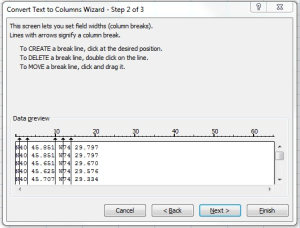
- We must separate the N and W from the degree column. To do this, click between the "N" and "40" and between "W" and "74." Then hit "Next →" (click image to enlarge)
- Do not make any changes in step 3 of the Wizard. Just hit "Finish" to exit.
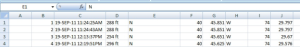
- You will see that the single coordinate column has now been divided into 6 separate columns. (click image to enlarge)
- The idea now is to isolate the latitude and longitude components each into a single column. At this stage it is best to reorganize the columns.
- Clear the contents of the "E" and "H" columns by right clicking on the columns and selecting "Clear Contents." The coordinate information should now exist in two sets of columns with space in between them.
- To convert the two columns into a single column with the coordinates in Decimal Degree, we must write a formula to convert the data. Since the degree and minute system is based on intervals of 60, you must add the two columns together and divide by 60.
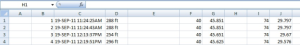
- To start writing the formula, first select the first box in the "H" column (H1).
- After the box is selected, click on the formula bar directly above it and type: =F1+G1/60. Hit enter. (click image to enlarge)
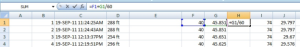
The number in H1 now contains all the information of the location in a single real number.
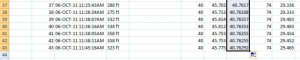
- To convert the rest of the column with the same formula, simply click the lower right corner of the box H1 and drag your cursor all the way down to the bottom row. (click image to enlarge)
- Repeat this formula to convert the other column by selecting the first box in the "K" column (K1) and typing =-(I1+J1/60). Hit Enter. (click image to enlarge)
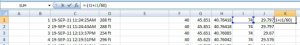
In this formula you must add a "-" (minus sign) in the front since this column contains the Longitude information. The minus sign in front of the number replaces the "W" to signify that the coordinate is in the western hemisphere, making it a negative number.You do not need to make this change if you are converting data points from the eastern hemisphere - anything east of Greenwich Mean.
- To convert the rest of the column, click the lower right corner of the box K1 and drag your cursor all the way down to the bottom row.
- At this point the H and K columns have the coordinate information in Decimal Degrees that ArcMap needs to generate points. To make the process of geocoding the points easier, it is a good idea to create headings for each column.
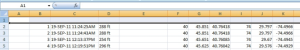
- Click on the small box "1" in the column on the left side of column A. This will highlight the entire first row. (click image to enlarge)
- Right click the box "1" and select "Insert." This will add a new blank row to the top of the table.
- Add the appropriate headings, as shown below: (click image to enlarge)
- Save the Excel document as "GPSpoints" and close Excel.
View the GPS data in ArcMap
- Open ArcMap10 and start with a blank document.
- To prove that our GPS points are drawn in the correct place, first add a Basemap.
Add a Basemap
- Click the drop down next to the "Add Data" button.
- Select "Add Basemap."
- Choose "Imagery" (or another basemap that you may prefer).
- Click "Add."
Add Excel GPS Data
- Click the "Add Data" button and navigating to where you saved the "GPSpoints" file.
- Select the .xlsx file and
- click "Add."
- Select "Sheet1$" and
- Click "Add."
- Right click "Sheet1$" in the Table of Contents and "Open" the table. You should see that the table has been formatted nicely.
- Close the table. (click image to enlarge)

Display Your Data Points
- Right click on "Sheet1$" again.
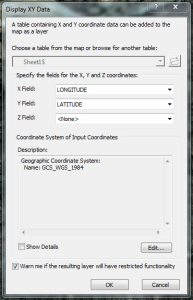
- Select "Display XY Data."
- In this dialog box, the only thing you must do is edit the coordinate system. To begin editing the coordindate system, click "Edit" in the bottom right.
- Click select on the next screen to choose the coordinate system.
- Navigate to WGS 1984 (Geographic Coordinate Systems > World > WGS 1984). (click image to enlarge)
- Hit "OK," then "OK" again to close these windows and display the coordinates on the basemap.
Check Your Data
To check that the points have been drawn in the right place: - Right click on the newly added "Sheet1$ Events" and
- Select "Zoom to Layer." The points should be drawn in a wooded area, scattered around a small man-made pond, south of the highway (Rt 287).
Final map
Your Final Map should look like the one in the picture below. (click image to enlarge)
